
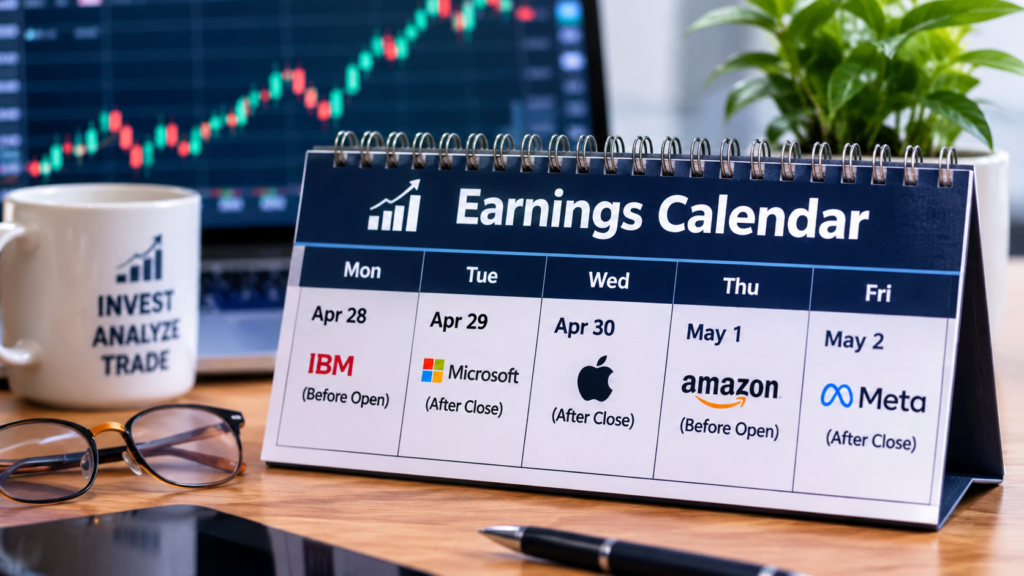
Earnings trading is a strategy in which investors trade stocks around a company’s quarterly or annual financial results. The objective is to profit from how the market reacts to the results, management’s outlook, and changes in expectations.
For Denarni Fokus, this is a valuable educational topic because earnings season connects corporate performance, stock valuations, institutional investing, volatility, options trading, and market psychology.
The most important concept to understand is this: a company can report record profits and its stock can still fall. The reason is that stock prices reflect expectations about the future, not just the results a company has already achieved.
Below is a practical guide with real-world examples, trading strategies, and reliable sources for further learning.
1. What moves a stock after earnings?
Investors typically evaluate five key factors.
| Factor | What investors examine | Why it matters |
|---|---|---|
| Revenue | Did sales beat or miss expectations? | Shows demand and business growth. |
| Earnings per share (EPS) | Was profit per share above or below consensus? | A key measure used in stock valuation. |
| Guidance | What does management expect for the next quarter or year? | Often more important than the quarter just completed. |
| Profit margins | Is the company becoming more or less profitable? | Reveals cost pressures and operating efficiency. |
| Market expectations | How much good or bad news is already priced in? | Helps explain why the stock may move contrary to the headline results. |
Companies generally release results before the market opens or after it closes. Investors then assess the financial statements, management commentary and forward guidance. syndication.finra.org
For further learning, start with these sources:
- FINRA — What Is Earnings Season? — Explains earnings season, analyst consensus, earnings surprises and why stocks can fall despite beating estimates.
- Fidelity — Trading Earnings — Explains the principal trading approaches and the role of options, volatility and market expectations.
Example: A company beats earnings but its stock falls
Imagine a technology company reporting the following:
| Metric | Market expectation | Actual result |
|---|---|---|
| Revenue | $10 billion | $10.5 billion |
| EPS | $2.00 | $2.20 |
| Next-quarter revenue guidance | $11 billion | $10.3 billion |
The company has beaten both revenue and EPS expectations.
However, its next-quarter outlook is significantly weaker than expected.
Possible market reaction: Investors sell because they believe future growth will slow. The weaker guidance may outweigh the positive results for the previous quarter.
These figures are hypothetical, but the scenario illustrates a real earnings-trading principle: investors trade the difference between expectations and new information, not simply whether reported numbers look good.
The reverse can also happen. A company may miss earnings expectations, but its shares rise because the results are less disappointing than feared or management provides a stronger outlook.

2. The four main earnings-trading strategies
There is no single way to trade earnings. Investors choose their approach based on their outlook, time horizon, risk tolerance and the amount of uncertainty already reflected in the stock price.
Strategy 1 — Buy before earnings
Objective: Profit if the company reports results that exceed expectations and the share price rises.
Suppose a company’s shares trade at $100 before its earnings announcement.
A trader believes that strong sales, improving margins and positive management guidance will surprise the market.
The trader buys 100 shares.
| Outcome | Share price after earnings | Position value | Profit/loss |
|---|---|---|---|
| Strong reaction | $110 | $11,000 | +$1,000 |
| No price change | $100 | $10,000 | $0 |
| Negative reaction | $90 | $9,000 | −$1,000 |
The original investment is $10,000, excluding transaction costs and taxes.
What the trader is really betting on: Not just strong earnings, but a sufficiently positive surprise relative to what the market already expects.
Main risk: The company may deliver good results that are already priced into its shares. Alternatively, weak guidance could trigger a sell-off.
This is one of the simplest approaches to understand, but it involves substantial event risk. Fidelity
Strategy 2 — Wait for earnings, then trade the reaction
Objective: Use the actual results and the market’s response instead of trying to predict the announcement in advance.
This approach may appeal to traders who prefer confirmation over speculation.
Consider a hypothetical company:
- Previous closing price: $100.
- Earnings are released after the market closes.
- The next trading session opens at $108.
- The company raises its annual revenue guidance.
- The stock holds above its opening price as trading continues.
A trader may interpret the stronger guidance and sustained buying interest as evidence that investors are reassessing the company’s prospects.
Rather than buying before the announcement, the trader waits for the market to react.
Possible techniques include:
- Breakout trading: Entering after the price moves above a clearly defined resistance level.
- Pullback trading: Waiting for a retracement after the initial move and assessing whether buyers return.
- Trend confirmation: Monitoring whether the price sustains its move rather than immediately reversing.
The important distinction is that a positive earnings report does not automatically create a good trading opportunity. The share price may gap up too far, leaving an unattractive entry point, or reverse as investors take profits.
This approach reduces the need to predict the announcement, but it does not eliminate risk. The price can reverse sharply, particularly around market open.
Strategy 3 — Trade a negative earnings surprise
Objective: Profit from a price decline when results or guidance disappoint investors.
Suppose a company is expected to report EPS of $1.50 but delivers $1.10. Management also warns that demand is weakening.
A trader believes the market has not fully adjusted to the deterioration in the business.
Possible approaches include:
- Selling shares already owned: Reducing exposure before or after the announcement.
- Short selling: Borrowing shares, selling them and attempting to repurchase them at a lower price.
- Buying put options: Purchasing a contract that can gain value if the underlying shares fall, subject to the option’s terms and pricing.
Short selling can generate substantial losses if the stock rises, and losses on an uncovered short position can theoretically be unlimited. Options introduce additional risks, including time decay and the possibility of losing the entire premium paid.
A more conservative alternative for a long-term investor may simply be to wait until the new information has been assessed.
Strategy 4 — Trade volatility rather than direction
Objective: Position for a large price movement without necessarily predicting whether the stock will rise or fall.
This is where earnings trading becomes more advanced.
Some traders use a long straddle, which involves buying both a call option and a put option with the same strike price and expiration date.
The strategy can benefit from a sufficiently large move in either direction. However, the combined options premium can be expensive before earnings, and the stock must move far enough to offset the cost.
For example, imagine:
- Stock price: $100.
- Call option premium: $4.
- Put option premium: $3.
- Total premium paid: $7 per share.
Ignoring transaction costs, the expiration break-even prices are:
- Upper break-even: $107.
- Lower break-even: $93.
If the stock finishes at $104, the strategy loses $3 per share at expiration. If it finishes at $115, it generates an $8-per-share profit before costs.
The example is hypothetical and assumes standard option payoff mechanics. Actual options may have different prices, contract multipliers and exercise terms.
The critical lesson: Being correct that a stock will move significantly is not enough. The movement must be large enough to overcome the price paid for the options.
Academic research confirms that earnings announcements create substantial event risk that is reflected in option prices. Research also finds that options can become expensive around these events, making volatility strategies unprofitable even when the underlying stock makes a substantial move. OUP Academic
Further reading: Fidelity — Trading Earnings and Options Strategies.

3. What do professional investors actually do before earnings?
Professional investors do not all trade the same way. A portfolio manager managing billions of euros may approach earnings very differently from a short-term trader.
However, several activities are common across institutional research and active trading.
Step 1 — Build an expectations model
Investors compare a company’s expected performance with its historical results, analyst forecasts and management guidance.
For example, before a technology company reports earnings, an analyst might examine:
- Revenue growth over the previous four quarters.
- EPS estimates and the range of analyst forecasts.
- Gross and operating margins.
- Customer growth and demand trends.
- Capital expenditure and cash flow.
- Management’s previous guidance versus actual results.
- The company’s valuation relative to its expected growth.
The goal is to determine whether the market’s expectations are reasonable, too optimistic or too pessimistic.
Important distinction: A company reporting 20% revenue growth is not necessarily impressive if the market expects 30%.
Step 2 — Identify the most important metric
Not every number matters equally for every business.
| Company type | Metrics investors may prioritize |
|---|---|
| Technology and AI | Revenue growth, cloud demand, margins, capital expenditure |
| Banks | Net interest income, credit losses, loan growth, capital ratios |
| Semiconductor companies | Chip demand, margins, inventory, forward guidance |
| Retailers | Comparable-store sales, margins, inventory, consumer demand |
| Oil and energy companies | Production, realized prices, costs, cash flow |
| Automotive companies | Deliveries, average selling prices, margins, inventory |
| Pharmaceutical companies | Product sales, pipeline developments, research costs |
These are examples of sector-specific analytical priorities, not universal rules. An investor should identify the metrics that best explain the company’s earnings power and future prospects.
Step 3 — Compare consensus with the company’s likely results
Imagine that analysts expect a company’s quarterly EPS to be $2.00.
An investor develops three scenarios:
| Scenario | EPS | Interpretation |
|---|---|---|
| Bear case | $1.70 | Weak demand or margin pressure |
| Base case | $2.00 | Results broadly match expectations |
| Bull case | $2.30 | Stronger demand or better margins |
The investor then asks a more difficult question:
What would each scenario mean for the share price, given the company’s current valuation?
Suppose the stock trades at $100 and the market values it at 25 times annualized quarterly EPS. This is a simplified valuation illustration, not a complete valuation model.
If quarterly EPS is $2.00, annualized EPS is $8.00, producing a 12.5-times multiple at a $100 share price—not 25 times. To apply a 25-times P/E multiple consistently, the investor would need to use annual EPS of $4.00 or adjust the assumptions.
This distinction matters: analysts must use consistent periods and comparable valuation measures when translating earnings estimates into prices.
Step 4 — Examine positioning and volatility
Investors also examine what the market may already have priced in.
They may review:
- Recent share-price performance.
- Analyst estimate revisions.
- Options-implied volatility.
- The options market’s implied earnings move.
- Trading volume and liquidity.
- Peer-company results.
- The broader market environment.
For example, if a stock has rallied 20% in the weeks before earnings, expectations may already be elevated. Even a strong report might not trigger another rally.
Options-implied volatility is especially relevant because it provides a market-based measure of expected price variability. It does not predict the direction of the move or guarantee a particular outcome. Research published in The Review of Finance in 2025 also illustrates how earnings-related volatility can be expensive to trade. OUP Academic
Step 5 — Decide whether the trade offers enough potential reward
An investor can have a correct view of a company and still lose money if the entry price is too high or the market reaction differs from expectations.
Before entering a trade, experienced investors may define:
- Their expected outcome.
- The conditions that would invalidate their thesis.
- The maximum acceptable loss.
- Their position size.
- Their intended holding period.
- Whether they want to hold through the announcement at all.
Some investors decide that the risk of holding through earnings is not worth the potential return.
4. What happens after earnings? An example of a real trading concept
One of the most interesting areas of academic finance is the post-earnings-announcement drift (PEAD).
The concept describes a pattern in which a stock’s price continues moving in the direction of its earnings surprise after the announcement, rather than adjusting fully and immediately.
For example:
- A company reports earnings substantially above expectations.
- Its stock rises 5% on the announcement.
- Investors continue revising their expectations upward.
- The stock potentially continues rising over subsequent trading sessions or weeks.
The reverse pattern may occur after negative surprises.
Researchers have studied this phenomenon for decades. A 2021 review in the Journal of Behavioral and Experimental Finance examined more than 200 published and working papers, discussing possible explanations including investor attention, trading frictions and behavioral biases. The evidence does not establish that PEAD is a guaranteed or consistently profitable strategy. DOI
How could an investor study this?
An investor researching PEAD might:
- Identify companies that reported earnings surprises.
- Measure the stock’s performance around the announcement.
- Examine whether analyst forecasts were subsequently revised.
- Track returns over the following days and weeks.
- Compare results with an appropriate market benchmark.
- Include transaction costs and test whether the pattern persists across different periods.
This is a research framework, not a trading recommendation. Historical patterns can weaken or disappear, and a backtest may not translate into live trading profits.
Reliable academic sources:
- Review of Post-Earnings-Announcement Drift — Journal of Behavioral and Experimental Finance
- Post-Earnings-Announcement Drift in Global Markets — The Review of Financial Studies
The second paper examines how changes in financial-reporting quality relate to PEAD across international markets.
5. Real-world case study: Why Nvidia earnings matter beyond Nvidia
Consider an illustrative earnings-trading exercise using NVIDIA.
Nvidia is an interesting case because its results can influence expectations across the AI infrastructure ecosystem.
A trader studying Nvidia’s earnings might examine more than reported revenue and EPS.
| Research area | What the investor wants to understand |
|---|---|
| Data-center revenue | Is demand for AI computing infrastructure accelerating? |
| Gross margin | Is the company maintaining pricing power and profitability? |
| Forward guidance | Does management expect demand to remain strong? |
| Supply constraints | Can the company deliver enough products to meet demand? |
| Customer spending | Are major technology companies continuing to invest in AI infrastructure? |
| Valuation | How much future growth is already reflected in the share price? |
Three possible scenarios
Scenario A — Strong results and stronger guidance
Nvidia beats expectations and raises its outlook. Investors may revise their forecasts upward, while other AI-related stocks may also benefit from improved sector sentiment.
Scenario B — Strong results but weaker guidance
Nvidia beats quarterly expectations but signals slower future growth or margin pressure. Investors may sell the stock despite the headline earnings beat.
Scenario C — Results meet expectations
The numbers are broadly in line with consensus, but the share price falls because investors had anticipated a larger surprise.
These are hypothetical scenarios, not descriptions of a specific earnings announcement.
Why examine related companies?
Professional investors frequently consider how one company’s results affect others in its industry.
For Nvidia, they might examine companies exposed to semiconductor manufacturing, chip equipment, cloud infrastructure and AI-related capital expenditure.
However, correlated businesses do not necessarily respond in the same direction. Their valuations, competitive positions and financial results may differ.
For educational research, use the company’s own financial disclosures rather than relying exclusively on headlines.
- NVIDIA Investor Relations — Earnings releases, financial results and management commentary.
- SEC EDGAR Company Filings — Official filings for publicly listed companies in the United States.

6. How do earnings traders find opportunities?
A practical way to understand earnings trading is to follow the process from the initial research to the final trade decision.
Here is a simplified workflow.
| Stage | What the trader does | Main question |
|---|---|---|
| 1. Calendar | Identifies upcoming announcements | Which companies report soon? |
| 2. Research | Reads company reports and analyst estimates | What does the market expect? |
| 3. Forecast | Develops bull, base and bear scenarios | What could surprise investors? |
| 4. Valuation | Assesses the current share price | Is the expected outcome already priced in? |
| 5. Risk analysis | Reviews volatility and potential losses | How much could the position lose? |
| 6. Decision | Buys, sells, hedges or avoids the trade | Is the potential reward worth the risk? |
| 7. Monitoring | Reviews results, guidance and price action | Is the original thesis still valid? |
Not every investor follows this sequence mechanically. Long-term investors may focus more on fundamental value, while short-term traders may pay greater attention to price action and volatility.
What data should you track?
For each company, record:
- Ticker and earnings announcement date.
- Expected revenue and EPS.
- Previous-quarter and year-over-year growth.
- Management’s previous guidance.
- Actual results.
- Percentage surprise relative to consensus.
- Share-price change after the announcement.
- Forward guidance and analyst estimate revisions.
- Relevant sector and market movements.
Over time, this creates a dataset that can help you evaluate how different types of earnings surprises are associated with subsequent stock performance.
7. Where to learn earnings trading from reliable sources
These are useful starting points, ordered roughly from practical education to academic research.
| Source | What to learn |
|---|---|
| FINRA — What Is Earnings Season? | Consensus estimates, earnings surprises, company disclosures and market reactions. |
| Fidelity — Trading Earnings | Trading before and after earnings, options strategies and risk. |
| SEC — EDGAR Company Filings | Primary-source financial statements and company disclosures. |
| NVIDIA Investor Relations | A practical example of earnings releases and investor materials from a major technology company. |
| Review of Post-Earnings-Announcement Drift | Academic evidence on how stock prices may respond to earnings surprises over time. |
| Option Pricing of Earnings Announcement Risks | Academic research into how earnings-event uncertainty is reflected in options prices. |
Suggested learning exercise
Choose three companies from different sectors, such as a technology company, a bank and a retailer.
For each company:
- Read the latest earnings release.
- Write down the market’s expectations before looking at the actual result.
- Identify the three most important financial metrics.
- Record whether the company beat or missed expectations.
- Read management’s forward guidance.
- Examine the stock’s reaction after the announcement.
- Write down why the reaction may have differed from what you expected.
Repeat the exercise across several earnings announcements before attempting to assess whether a particular trading strategy has an advantage.
8. The most important lessons
1. An earnings beat is not automatically bullish. Future guidance, valuation and expectations can matter more than the headline result.
2. A stock can move significantly in either direction. Earnings announcements introduce uncertainty that can produce sharp price changes.
3. Professional investors assess risk as well as opportunity. Their decisions depend on the potential reward, the probability of different outcomes and the size of the possible loss.
4. Options are not a simple shortcut. A trader can correctly anticipate a large move and still lose money if the options were too expensive.
5. Long-term investing and earnings trading are different activities. A long-term investor may use earnings to reassess a company’s fundamental value, while a short-term trader may focus on the immediate market reaction.
6. Research matters more than the headline. Reading company filings, comparing expectations with actual results and studying historical reactions provides a stronger foundation than simply buying stocks that report good numbers.
For a beginner, the most useful starting point is to study earnings announcements and subsequent price reactions without placing trades. This makes it easier to understand how expectations, guidance, valuation and volatility interact before taking financial risk.
Check out our Company Earnings Calendar: https://denarnifokus.com/earnings-calendar/
Earnings Research — Key Sources
- FINRA — Earnings Season Guide: Read more
- Fidelity — Trading Earnings: Read more
- Fidelity — Earnings Research Glossary: Read more
- SEC EDGAR — Official Company Filings: Search filings
- NVIDIA Investor Relations — Earnings Reports: View reports
- Post-Earnings-Announcement Drift Review (2021): Read paper
- Post-Earnings Drift in Global Markets: Read paper
- Option Pricing of Earnings Announcement Risks: Read paper
- Investor Attention and Earnings Announcements: Read paper
- Seasonal Earnings Releases and Price Drift (2023): Read research
- The Information Content of Guidance and Earnings: Read paper
- Post-Earnings Drift and Revenue Surprises: Read paper